A shallow dive into auto-instrumenting Node.js applications with Elastic APM
I don't work for Elastic (yet😄), but I'm a big fan of their products. In fact:
Elastic APM in particular is one of my favourite pieces of software.
— jukai (樹海) (@theshalvah) November 25, 2020
One thing I love about the Elastic APM agents, especially for Node.js, is how easy setup is. All you need to do is:
require('elastic-apm-node').start();
and your application is automatically instrumented.
Instrumentation is...
If you aren't familiar with instrumentation, think of it as watching, measuring, and recording. When you instrument an operation, you watch for when it starts and ends, and you measure and record interesting data about it.
For instance, if we instrument an API call, we would likely want to measure how long the call took. We'd also want to record the URL, the response code, the HTTP headers returned, and so on. By recording these information about actions in our app, we can have enough useful data to debug problems, recognise patterns, and much more.
So what do you get when you instrument an application with Elastic APM? Data like these:
- How many requests your app gets and how long it takes to respond to them

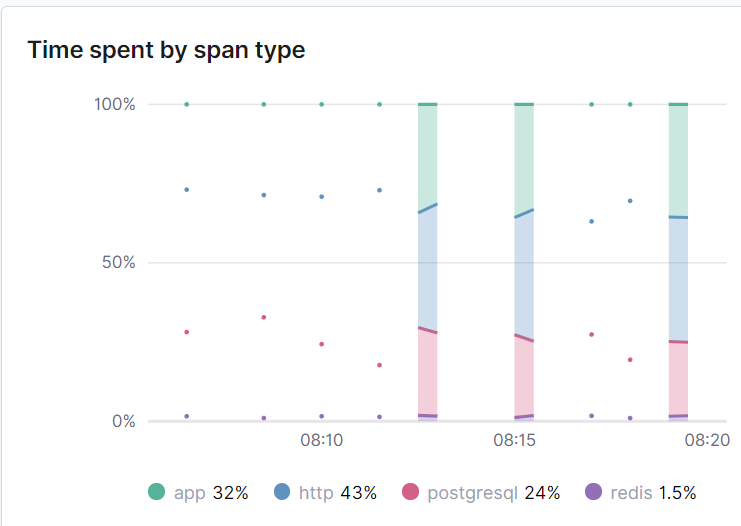
- Where most of your app's request-handling time is spent (database? redis? external API calls?)

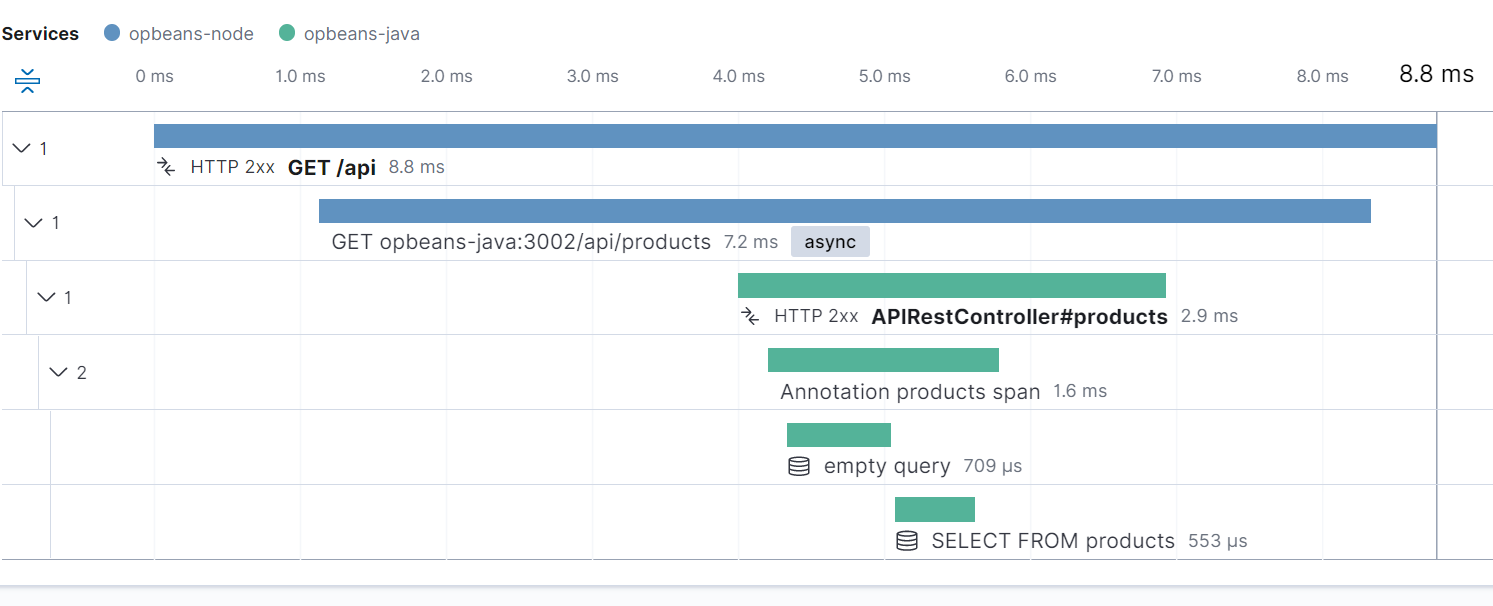
- The actual database queries you made during a request, and how long each took (and other metadata)

- The API calls you made, and how long they took (and other metadata)

There's a whole lot more. See Elastic's demo site.
How do I instrument my app?
The most direct way to instrument your app would be to do everything manually. Before you start any operation (API call, database query, or anything you consider a "unit of work"), you record the time you start and any useful data. When it's done, you calculate the time spent and record any other data. For example, if our app sends out newsletters and we want to watch that:
// Start the span and record any useful context
const span = apm.startSpan('newsletter-dispatch');
span.setLabel('group', group);

// Do the database queries, API calls, etc

// Record any useful data and end the span
span.setLabel('newsletters-sent', numberSent);
// The time taken will be automatically added
span.end();
A number of instrumentation libraries, such as Jaeger and the OpenTracing JS client work this way.
The manual approach is alright for recording custom operations, but it can get pretty tiring doing it for every database query or API call. For that, there's another approach: having the dev explicitly request instrumented wrappers of their libraries. For instance, to automatically [instrument your PostgreSQL queries with Zipkin, you'd need to wrap the pg module with Zipkin's library and use that for your database queries.
Automatic instrumentation
An even better option is auto-instrumentation, where the APM library automatically identifies the libraries you use and track the operations you do with them. This is how Elastic APM works. Honeycomb's Beeline, DataDog's dd-trace and the OpenTelemetry Node.js client also provide automatic instrumentation. Of course, "operations" don't only happen when you interact with other libraries, so these libraries still let you manually add spans.
So how does automatic instrumentation work in Node.js? How does the APM library know when you've started a new database query? It boils down to Node.js' module system (CommonJS), which allows you to see (and change) what happens when a module is require()d, combined with JavaScript's unique object-oriented flavour that lets you modify the behaviour of objects easily.
A quick dive into the internals
When you call the start() function on the APM client, it does a bunch of configuration and ends up in the Instrumentation class.
You'll notice a list of modules that are supported for instrumentation on line 13. For each module, the agent loads the patch (see the modules folder containing the patches for each module). Then the agent calls the hook() function. This is where the libraries are actually monkey-patched.
The hook() function is provided by require-in-the-middle, another Elastic library. Here's how you'd use the library:
// Assuming we want te make Node's fs.readFile() function Promise-ified,
// we could do this
const hook = require('require-in-the-middle');

// Hook into the fs module
hook(['fs'], function (exports, name, basedir) {
  const util = require('util');
  exports.readFile = util.promisify(exports.readFile.bind(exports));
  return exports;
});

// 😈
const fileContent = await fs.readFile('file.txt');

// You shouldn't do this, though. Use fs.readFileSync() or fs/promises
Internally, here's what the library does (simplified):
function hook (modules, onrequire) {
  const originalRequire = Module.prototype.require;
  Module.prototype.require = function (id) {
    // Call the real `require` and get the exported data
    const exports = originalRequire.apply(this, arguments);
    // Pass the export through the hook and return to the user
    return onrequire(exports, moduleName, basedir));
  }
}
Module.prototype.require is the require function that the user calls in their code, so we replace that with our own function that will pass the exports through the handler whenever require() is called.
Of course, in the real thing, there's a lot more, like caching, resolving module paths, and handling race conditions. If you'd like to read more about the module system, the Node.js docs are pretty detailed. I've also written a bit about some testing libraries that hook into the Node.js module system. And here's an example of someone else hooking into require.
The last main part is to define the instrumentation for each module, typically by studying its internal API and overwriting those methods. For instance:
- The
mysqlinstrumentation wraps thegetConnectionmethod on the MySQL pool, so that the connection that is returned reports on queries - The Redis instrumentation wraps the
RedisClient.prototype.internal_send_commandmethod so that any new clients will automatically start spans before sending any commands.
The APM library uses the shimmer module for this wrapping.
shimmer.wrap(object, method, function (original) {
  return myInstrumentedMethod;
});
This is the same as doing object.method = myNewMethod, but Shimmer handles a bunch of edge cases and possible errors, and allows you to reverse it easily, as well.
So there you have it. We've skipped over a bunch of stuff, but these are the basics of how Elastic APM (and other auto-instrumenting libraries for Node.js) work. There's a lot more in the source code if you want to learn more.
I write about my software engineering thoughts and experiments. Want to follow me? I don't have a newsletter; instead, I built Tentacle: tntcl.app/blog.shalvah.me.