How we cut down our CI build times by 50%
This is a re-post of an article I wrote for my company's blog.
Here's a story of how we improved our CI run times in one of our core Ruby services by up to 50%.
Initial state
First off, this is a fairly large service (over 600MB on my machine). We aren't a large company, but this is one of our core services, so multiple teams and devs often have to work with it. Over time, the codebase has grown, and even though we groom it occasionally, we ended up in an undesirable state: our builds were slow.
Here's our build structure: we run on CircleCI, with three jobs that run in parallel-one for code checks, one for linting (Rubocop), and one for tests (RSpec). The RSpec job is further parallelized, split across 10 processes, using CircleCI's parallelism features.
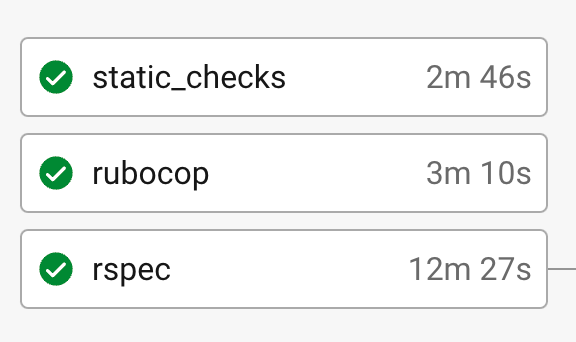
Despite all this parallelism, it could take anywhere from 12 to 16 minutes for your pull request to finish building. Here are some example runtimes:
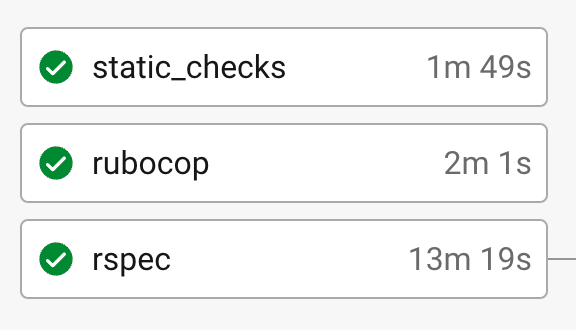
Now, in some worlds, a 15-minute build time isn't so bad, but not here. The repo is large, but not huge. It doesn't have many complex dependencies or test setups. We had 18k tests at the time, but many of them are small tests. It shouldn't take that long.
Why are slow builds so bad, anyway? The big reason is that they're bad for productivity, especially when CI is an important part of your work. We have so many tests that running them all locally takes forever, so you typically only run the ones related to your changes, and then open a PR so CI can run everything.
But now you have to wait 15 minutes to find out if all tests pass. What do you do? Switch to another task, go on a break, or do the ol' swordfight? Whichever you chose, 15 minutes later, the build is done, and if tests failed, you have to switch context again to fix them. And so on. Fast feedback loops are very helpful for software development velocity. It's why "language server" tools are very common.
Additionally, slow builds could also mean you're spending more money, since most CI systems have runtime-based pricing. Maybe we could fix this as well.
So the goal here was to speed up build time. Bonus points if we could do it without increasing costs. Since the main bottleneck was the RSpec job, the focus was to optimize that, but it would also be good if we could reduce the time taken by the other jobs as well, so the dev can get faster feedback.
Alright, time to dig in.
Improvement 1: Quick wins
We started by finding "easy wins". Were there any obvious things or configurations we could change? Luckily, CircleCI's build output is very detailed, showing you the log output and time spent on each step of a job. This let us see what steps we could easily get rid of. Turns out there were quite a few, mostly things that had been copied over from some other job or service's configuration:
- We were starting a Redis container in the
rubocopandstatic_checksjobs, but they didn't do anything involving Redis. - We were installing some additional apt packages in the
static_checksjob, which again weren't needed. - We had an extra step, "Waiting for Postgres", where we'd ping the Postgres server to check if it was up before proceeding with tests. While it didn't take a significant amount of time, it was also unnecessary-the Postgres server was always up by that time.
- We were running
rails db:createin our "Database setup" step, which always gave the warning "database already exists" (since we had started the Postgres container with aPOSTGRES_DBvariable). Again, not really a time killer, but unnecessary, so off it goes.
As expected, there wasn't much to gain here, except for the apt install step, which saved us 20 seconds on the static_checks job. That's a good start.
Improvement 2: Postgres' durability features
Next, another "easy win". I'd read a long time ago that a quick way to speed up tests which call the database is to disable fsync. Essentially, doing this forces your database to keep things in memory instead of writing them to disk. This is bad for a real database (if the process crashes, all your data is lost), but perfect for tests (nobody cares if your test process crashes).
In addition to fsync (docs), there were also some more things we could disable:
Similar to fsync, these are designed to ensure data integrity, but in a test setup, they don't matter. You can read more about these in the Postgres doc on non-durability. and explore some benchmarks from Gitlab here. Interestingly, CircleCI's old Postgres images had these features disabled by default, but the newer ones don't seem to.
So we changed our Postgres startup command from postgres to postgres -c fsync=off -c synchronous_commit=off -c full_page_writes=off.
The result: the average time per test process decreased by around a minute. Nice! But not good enough. Going from 15 minutes to 14 minutes is nice, but we can hopefully do better.
Improvement 3: Use the cache
I call the optimizations thus far "easy wins" because they were low-hanging fruit–things we could just turn on or off for instant improvements. In general, optimizing tests is rarely easy, and often depends on things specific to your setup. To get the true gains, we'd likely need to dig deeper.
While testing these changes, I noticed that initial builds on a new branch were still pretty slow. For instance, here's the first build vs the second build, on the same branch:


That's more than a full minute slower on the first build! This is a significant problem because we use feature branches in our workflow, so creating new branches is something that happens daily. Ergo, we will have a lot of "first builds".
To debug this, I took a look at the build output, and it was immediately obvious that something wasn't right with the cache.


For context, this series of steps is where we install dependencies (bundle install). The normal flow is:
- check for an existing cache of deps
- if there is a cache, install only any missing deps
- if no cache, install afresh
- upload the installed deps as the new cache (if you installed any extra deps)
As you can see in the output, the "Saving cache" step takes a minute and a half on the first run. It didn't take much to figure out that, for some reason, we were not finding a cache in the "Restoring cache" step, so dependencies were being installed afresh and a new cache uploaded.
It turned out that this was because we were including the branch name in the cache key, so:
- branch
feature-Awouldn't find a cache calledcache-feature-A, so would install afresh and save a new cache calledcache-feature-A - branch
feature-Bwouldn't find a cache calledcache-feature-B, so would install afresh and save a new cache calledcache-feature-B
This makes no sense; all branches use the same codebase, so as long as our list of dependencies (the Gemfile.lock) hasn't changed, we should be able to use the same cache. This also meant we were using a bunch of cache storage that we didn't need.
To fix this, we upgraded to a newer version of the CircleCI orb that allowed us to omit the branch name from the cache key. This immediately fixed things. Now both initial builds and subsequent builds were equally as fast. And we now save on storage costs, since we now share the cache across branches. In the three months preceding this, we had used 500–900 GB of storage on this service each month; in the two months since, we've used 500GB in total.
Improvement 4: Better test splitting
It's getting better, but let's keep going. Let's take a closer look at the output from an RSpec job after these changes. This screenshot shows the time taken by each parallel process. Notice something?
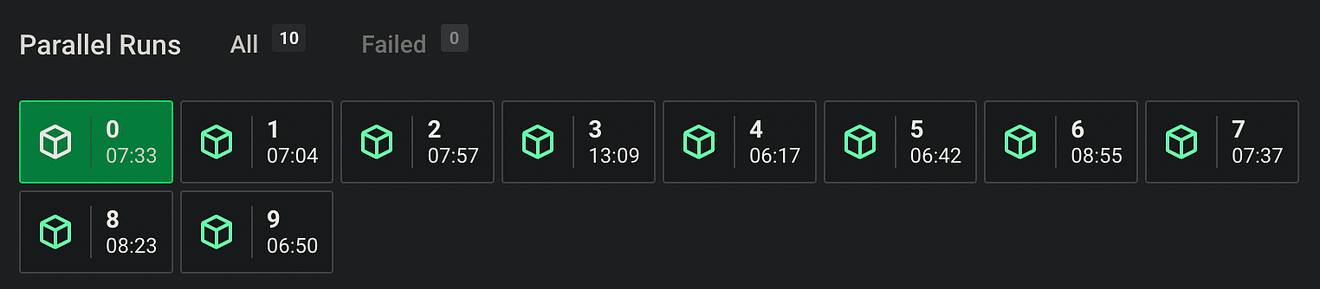
One process (process #3) takes much longer than the others. Here's another run:
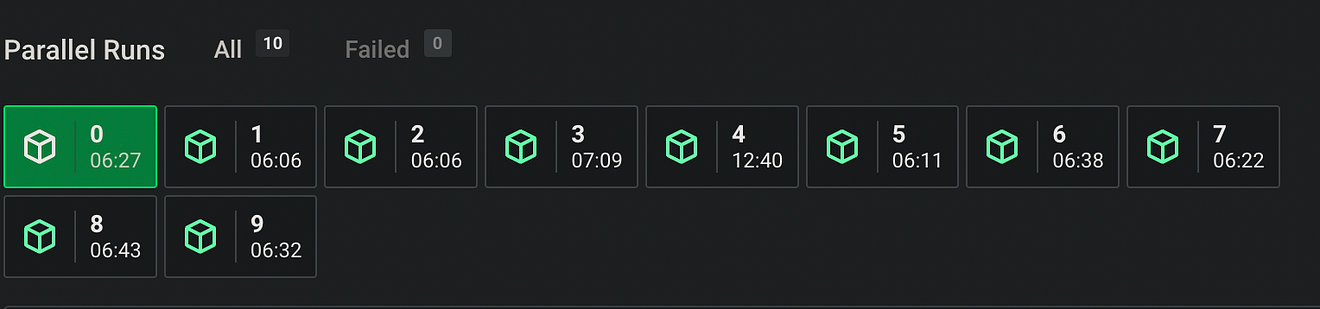
Here it's process #4 taking almost twice as long as the other processes.
This was happening on every run of our tests; there was always a process that took an insane amount of time. I call these "killer" processes because no matter how fast the other 9 processes are, they have to wait for that one to finish. Here's a look in detail, from a run where process 0 was the killer:
So why was this happening? To understand this, let's look at our test setup.
We use CircleCI's automatic test splitting, with a command like this:
circleci tests split --total=10 --split-by=timings
What this does is split our tests across n parallel nodes (for us, n = 10) based on the time each test takes. (Each process uploads the timing information to CircleCI when tests are done, so CircleCI knows how long the tests take.) CircleCI CLI splits our tests across our nodes in such a way that each node should take roughly the same amount of time. But that was clearly not what was happening. Something was wrecking the system.
RSpec has a profiling feature that tells you which of your tests are the slowest, but that didn't help here. So we had to go the manual way: check the output of regular test processes vs killer processes. The results were interesting:


The first thing you might notice is the number of tests. A regular process was running around 1000 tests, but the killer process was running nearly 9000! Now, obviously, some tests might take longer than others, so more tests isn't necessarily more time. But this was a start. Why was the number of tests disproportionately high here? To figure that out, I took the list of test files assigned to the killer process and cross-referenced it across a few builds, in order to find the file that was always present in each run.
It turned out the culprit was our "pricing test": a file that iterated over a bunch of configuration files and dynamically created tests for each configuration. But the problem wasn't in the runtime of the tests, it was in the setup process. This pricing test traversed a directory tree with nearly 100 configuration files, parsing these files (around 1MB in total) and creating a test for each entry in each file. And in fact, if you look at the screenshots above, you can see "files took 6 minutes to load". The problem wasn't in running tests; it was in loading them. The automatic test splitting was correctly assigning tests to the node based on the runtime, but it didn't include the load time.
This is a side effect of RSpec's design: "tests" are broken down to the individual level (also called "examples"), and very little can be registered at the test suite level. So RSpec's profiler and most other tools can tell you which tests are slowest, but they can't tell you anything about test suites. If we had suite-level granularity, we'd have caught this earlier.
To fix this, we switched to a manual test splitting strategy: we'd dedicate one node for the pricing test file and split the other tests across the other 9 nodes. This way, things should be more balanced.
if [[ "$CIRCLE_NODE_INDEX" == "$(($CIRCLE_NODE_TOTAL - 1))" ]]; then
  # If the current node is #9, run only the pricing test
  echo "spec/pricing/pricing_spec.rb" > tmp/circleci/tests_to_run.txt
else
  # For other nodes, remove the pricing test and auto-split the other tests
  circleci tests glob "spec/**/*_spec.rb" \
    | sed 's/spec\/pricing\/pricing_spec\.rb//g' > tmp/circleci/all_tests.txt
  circleci tests split --total=$(($CIRCLE_NODE_TOTAL - 1)) \
    --split-by=timings < tmp/circleci/all_tests.txt \
    > tmp/circleci/tests_to_run.txt
fi

bin/rspec $(cat tmp/circleci/tests_to_run.txt)
This worked. ✅
Neat, isn't it?
Some more quick wins
To top things off, we implemented a few more quick wins:
- Shallow checkout: By default, CircleCI's checkout step clones your entire Git repo. But you don't need your entire Git history to run tests-you just need the current codebase. Using shallow checkout (
git clone --depth 1 --branch $branch) only clones the current state of the branch. For us, this saved around 3 seconds on each job. - Linting only changed files: We were previously running Rubocop on the entire repo, but that took a full minute. We switched this to lint only files that have been modified between this branch and
main.
# Get all files that have been changed since we branched from main (exclude deleted files)
echo 'These added/changed files will be inspected:'
git diff-tree -r --no-commit-id --name-status --diff-filter=d \
  --merge-base origin/main "$CIRCLE_BRANCH"

git diff-tree -r --no-commit-id --name-only --diff-filter=d \
  --merge-base origin/main "$CIRCLE_BRANCH" \
  | xargs bundle exec rubocop --only-recognized-file-types --force-exclusion
This was a big improvement, cutting down Rubocop from over a minute to ~20s on most builds.
Results
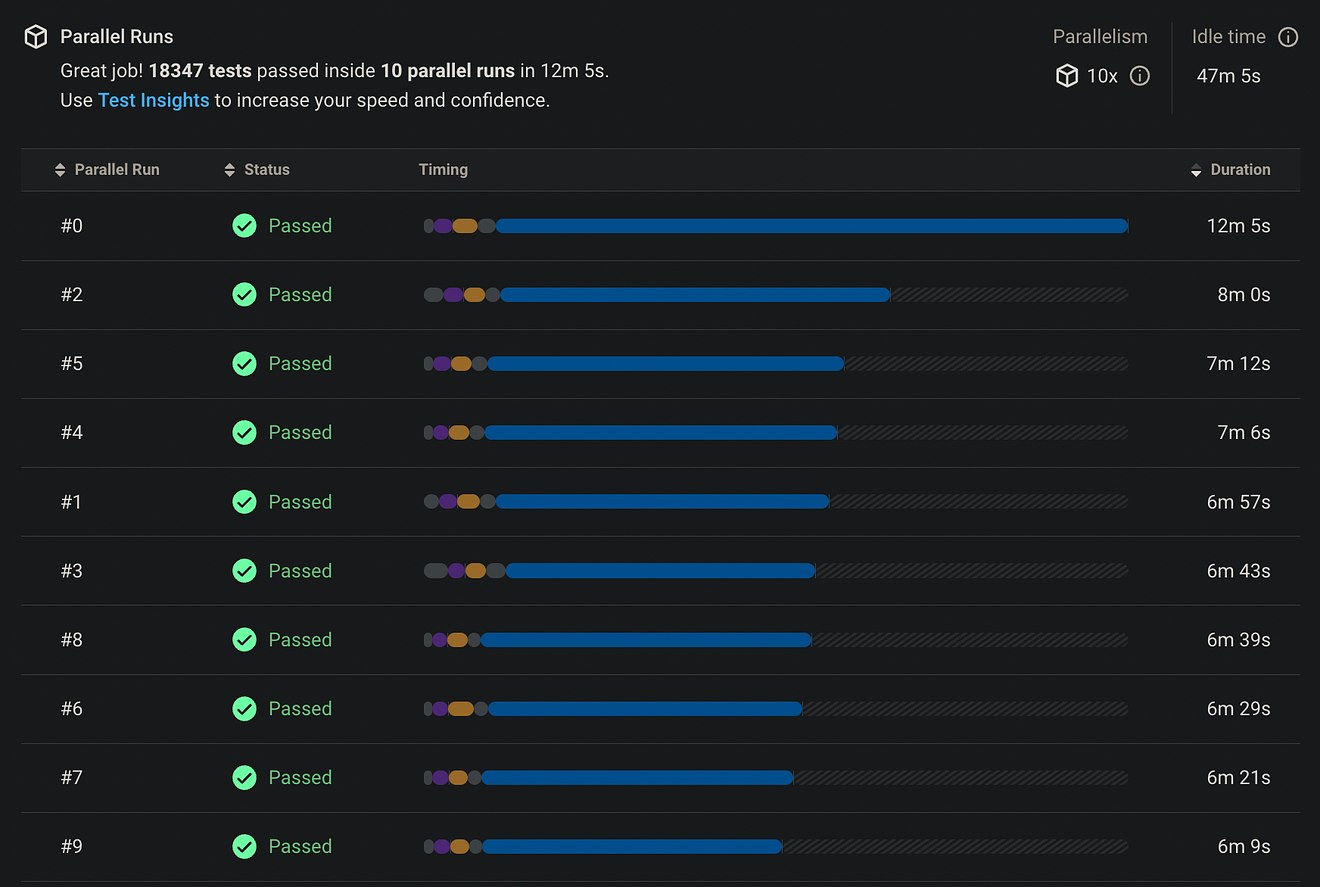
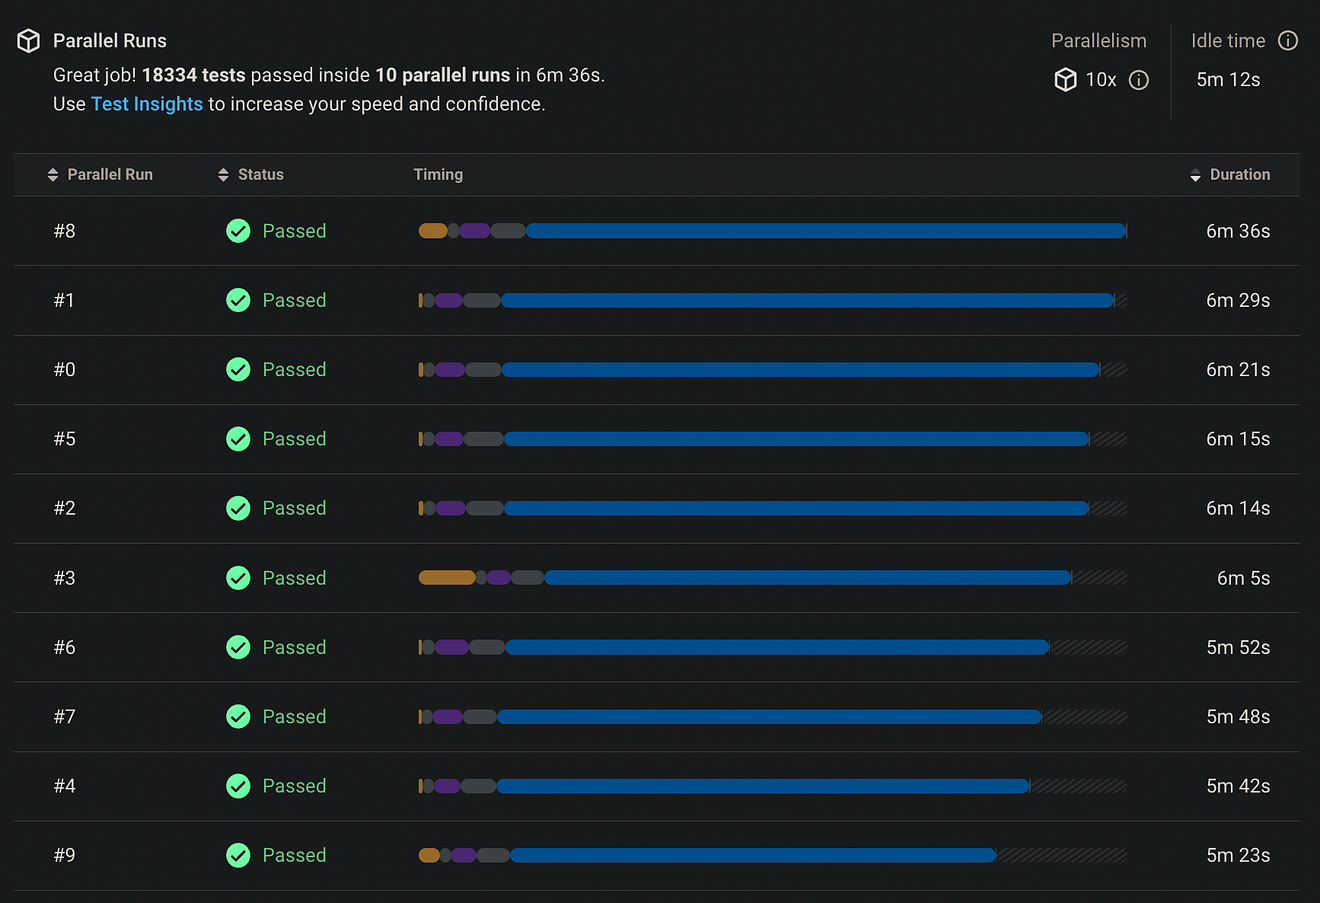
So what was the overall effect? Here's a "before vs after" for our parallel RSpec job:


And here's the whole workflow on a new branch (before) vs existing branch (before) vs new or existing branch (after):


We're now at 19.5k tests (as I said, we're always adding tests), so the runtime is a bit more now, but still much better than what we had before.
We also achieved our goal of not increasing costs. In fact, we bettered it. CircleCI charges based on runtime and machine size, as well as storage. This means that reducing our runtime and cache usage translated to a direct cost reduction.
Along the way, we also noticed that some of our jobs did not specify a machine size, which meant we were using CircleCI's default (medium), and yet only utilizing around 10% of its CPU and RAM. So we switched to specifying small, which costs half as much, for even more savings.
Learnings and future possibilities
There are still more possibilities we could explore in future:
- Custom Docker image: We could switch to pre-building a Docker image so we aren't installing dependencies or fetching from cache on each build. This could save around ~30s, but it's more complex to set up and maintain.
- More test optimizations: Although we've found a workaround for the pricing test, it's likely that there are more efficient ways of defining these tests, and we'll keep looking into those.
- Setup/teardown code: We have some custom RSpec helpers that we wrap some tests in (for instance, an
exclusively_activate_producthelper deactivates all products except the one specified, allowing us to control the environment for that test). However, RSpec runs this setup individually for every test block, but in many cases, we only need to run it before/after a specific suite. We're looking into how these can be optimized.
The whole optimization process has reminded us of a few things:
- More hardware isn't necessarily the answer. At some point, I experimented with larger machine sizes and more parallel processes, but with no luck (because of the killer process). Bigger or more servers only help if you already understand your weak points.
- Use tools that give insights. CircleCI provides a bunch of great insights that let you pinpoint problems or bottlenecks in your workflow, and they greatly reduced the work we had to do.
- Most importantly, adapt as the codebase evolves. The build wasn't always slow; it just got worse over time. We add more tests every day (and remove some occasionally), so we should keep an eye on how the CI experience changes.
I write about my software engineering thoughts and experiments. Want to follow me? I don't have a newsletter; instead, I built Tentacle: tntcl.app/blog.shalvah.me.
