"Proving" time complexity empirically
How do you know that an algorithm is O(n) (or O(log n) or O(1), etc)? The first (and correct) answer is by analysis: if your algorithm loops over a set of n items, it's O(n); and so on. But have you ever wanted to verify this? Like, you've written an algorithm that looks like it should be O(1), but you want to see how it performs in the real world. Or you're not sure if converting an array to JSON is O(n). Well, you can verify it, by running it with actual data and looking at the results.
Recently, I had to implement a graph data structure. A graph has vertices, which can be connected by edges. I won't go into details about it, but what I'd read about my implementation claimed that checking for an edge and removing an edge were O(V) (where V is the number of vertices in the graph), but I felt that by using a map and set instead of lists, I had cut this time to O(1). I wanted to verify this.
The eyeball test
The first thing is to figure out what your variable (n) is, and create a set of test cases that vary n and keep other things constant.
With the example of my graph, I decided to start with a simple operation: adding a vertex. The variable was V, the number of vertices in the graph. My test would vary this number and see how long it took to add new vertices.
I decided to do it in chunks of 1000. I'd add 1000 vertices to the graph, then measure the time taken. At this point, V is now = 1000, and I'd add the next 1000, measure again, and so on.
// Generate an array of test cases for V: [0, 1000, 2000, 3000...]
const chunks = Array.from({length: 200}, (_, i) => i * 1000);

const g = new Graph();

for (let start of chunks) {
    const v = g.vertices.size;
    console.time(`Adding 1000 vertices, V = ${v}`);
    for (let i = start; i < start + 1000; i++) {
        g.addVertex(i);
    }
    console.timeEnd(`Adding 1000 vertices, V = ${v}`);
}
Here's what the results were like. There were 200 chunks, so I can't show everything, but here are the first 10 lines:
Adding 1000 vertices, V = 0: 3.152ms
Adding 1000 vertices, V = 1000: 0.39ms
Adding 1000 vertices, V = 2000: 1.687ms
Adding 1000 vertices, V = 3000: 0.585ms
Adding 1000 vertices, V = 4000: 1.56ms
Adding 1000 vertices, V = 5000: 0.644ms
Adding 1000 vertices, V = 6000: 0.396ms
Adding 1000 vertices, V = 7000: 3.268ms
Adding 1000 vertices, V = 8000: 0.987ms
Adding 1000 vertices, V = 9000: 0.339ms
and the final 10:
Adding 1000 vertices, V = 190000: 0.493ms
Adding 1000 vertices, V = 191000: 0.507ms
Adding 1000 vertices, V = 192000: 0.471ms
Adding 1000 vertices, V = 193000: 0.596ms
Adding 1000 vertices, V = 194000: 0.508ms
Adding 1000 vertices, V = 195000: 0.539ms
Adding 1000 vertices, V = 196000: 1.44ms
Adding 1000 vertices, V = 197000: 0.647ms
Adding 1000 vertices, V = 198000: 0.551ms
Adding 1000 vertices, V = 199000: 0.565ms
You can see that the first few results are a bit inconsistent, but by the end, it's nearly identical for every V—around 0.5ms. That looks a lot like constant time, O(1), since as we increase V, the time does not change significantly. But is this correct?
Drawing a graph
The limitation of our experiment above is that we're manually checking the results and comparing them in our head, and we can't compare 200 data points mentally. Let's go a step further—plot the data points on a graph (ie a diagram, not a data structure😅). Since we know that different time complexities are essentially different functions with different graph shapes, it should be quite easy to identify ours.
Plotting a graph is surprisingly simple, thanks to this nifty library, nodeplotlib. Here's the code for that now:
const { plot } = require('nodeplotlib');
const { performance } = require('perf_hooks');

const chunks = Array.from({length: 200}, (_, i) => i * 1000);
const g = new Graph();
const plotData = [
    {
        x: [],
        y: [],
        type: 'line',
        name: 'Time y to add 1000 vertices when there are x vertices in the graph'
    }
];

for (let start of chunks) {
    plotData[0].x.push(g.vertices.size);
    const startTime = performance.now();
    for (let i = start; i < start + 1000; i++) {
        g.addVertex(i);
    }
    plotData[0].y.push(performance.now() - startTime);
}
plot(plotData);
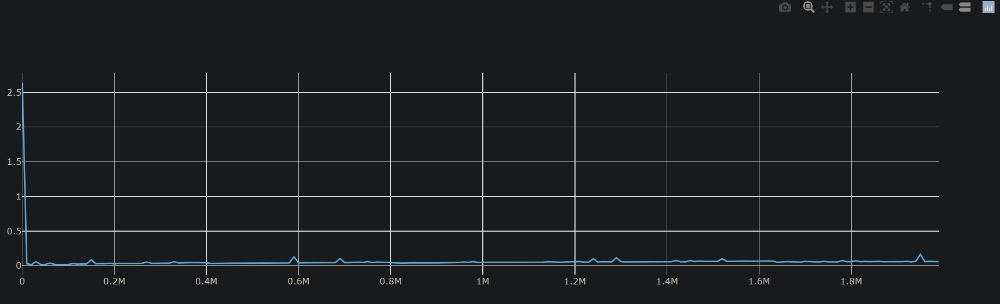
And when I run this, it opens up the plotted graph in my browser:
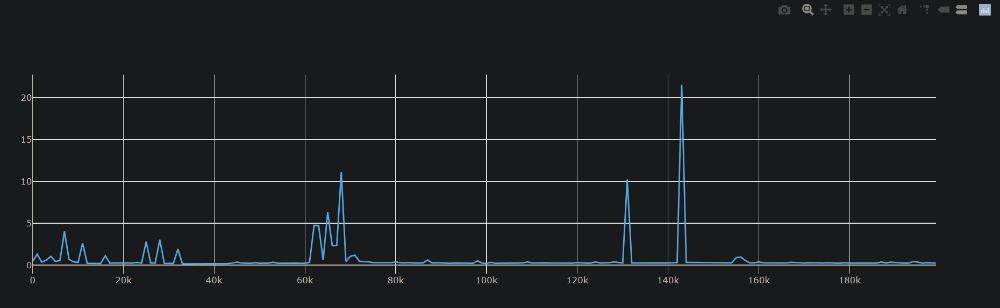
(I ran this multiple times, and each time, the graph had the same shape.)
Aha, now we have hard, easily-digestible data. We can see that the runtime is mostly constant, with some small spikes initially, and a few bigger ones later on. It's not a full straight line, as we might have expected for a theoretical O(1), but in the real world, things happen that affect runtime—garbage collection, memory allocation, other implementation details. I think we might be able to conclude that this is O(1).
Caution: you still have to pick a dimension
This was fun and pretty easy, but one thing to watch out for is picking the right variables. In this example, it was pretty obvious what our variable was, but it's not always like that. For instance, in the canonical description of my graph structure, removeEdge() was O(V), while removeVertex() was O(E) (E is the number of edges). (Some more advanced operations were even O(V + E).) If you pick the wrong variable, you'll get misleading results.
A demonstration. Here's a test for the removeVertex() operation that varies the number of vertices, V:
const plotData = [
    {
        x: [],
        y: [],
        type: 'line',
        name: `Time y to remove 1000 vertices when there are x vertices in the graph`
    }
];

const chunks = Array.from({length: 200}, (_, i) => i * 1000);
for (let start of chunks) {
    const g = new Graph();

    // First, add the number of vertices, V
    let numberOfVertices = 0;
    for (let i = 0; i < start + 1000; i++) {
        g.addVertex(i);
        numberOfVertices++;
    }
    plotData[0].x.push(numberOfVertices);

    // Then remove the first 1000 vertices
    const startTime = performance.now();
    for (let i = 0; i < 1000; i++) {
        g.removeVertex(i);
    }
    plotData[0].y.push(performance.now() - startTime);
}
plot(plotData);
This gives us something that's roughly constant time, again:
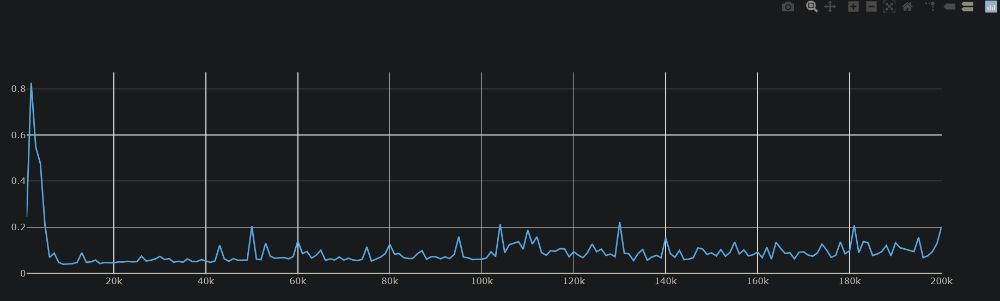
In this test, we're increasing V in intervals of 1000, and runtime remains constant. But E, the number of edges, also remains constant at 0. What happens if we switch things around? Do we still get that?
Here's a test that varies E instead, and keeps V constant:
// I adjusted the chunk interval and number of chunks to 100 each so it doesn't take forever.
const chunks = Array.from({length: 100}, (_, i) => i * 100);
const plotData = [
    {
        x: [],
        y: [],
        type: 'line',
        name: `Time y to remove 100 vertices when there are x edges in the graph`
    }
];

for (let start of chunks) {
    const g = new Graph();

    // First, add all the vertices
    for (let i = 0; i < chunks[chunks.length - 1] + 100; i++) {
        g.addVertex(i);
    }

    // Then add the number of edges, E, to the first 100 vertices
    let numberOfEdges = 0;
    for (let i = 0; i < 100; i++) {
        for (let j = 0; j < start; j++) {
            if (i !== j) {
                g.addEdge(i, j);
                numberOfEdges++;
            }
        }
    }
    plotData[0].x.push(numberOfEdges);

    // Now remove the first 100 vertices
    const startTime = performance.now();
    for (let i = 0; i < 100; i++) {
        g.removeVertex(i);
    }
    plotData[0].y.push(performance.now() - startTime);
}
plot(plotData);
And this is the graph I get:
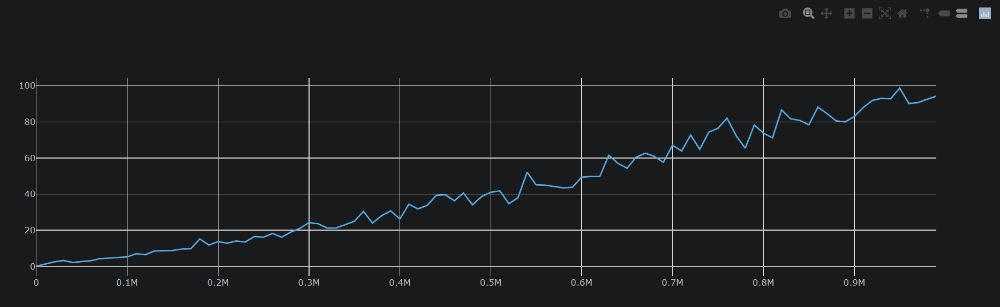
Boom, linear time! This is definitely O(n), where n = E, the number of edges. We can clearly see that as the number of edges in the graph goes up, the runtime also goes up.
This is why the theoretical analysis part is still important: it helps us identify the key variables, so we can test them properly. n isn't always the most obvious thing.
For completeness, here are the results from the operation I initially wanted to test, hasEdge(). Testing against V and E:
// First test: V varies, E constant
function hasEdgeTestOverV() {
    const chunks = Array.from({length: 200}, (_, i) => i * 100);
    const plotData = [
        {
            x: [],
            y: [],
            type: 'line',
            name: 'Time y to check for 100 edges when there are x vertices in the graph'
        }
    ];

    for (let start of chunks) {
        const g = new Graph();
        // First, add V vertices
        for (let i = 0; i < start + 100; i++) {
            g.addVertex(i);
        }
        plotData[0].x.push(g.vertices.size);

        // Then check for edges in the first 100 vertices
        const startTime = performance.now();
        for (let i = 0; i < 100; i++) {
            g.hasEdge(i, i + 1);
        }
        plotData[0].y.push(performance.now() - startTime);
    }
    plot(plotData);
}
// Second test: E varies, V constant
function hasEdgeTestOverE() {
    const chunks = Array.from({length: 200}, (_, i) => i * 100);
    const plotData = [
        {
            x: [],
            y: [],
            type: 'line',
            name: 'Time y to check for 100 edges when there are x edges in the graph'
        }
    ];

    for (let start of chunks) {
        const g = new Graph();

        // First, add all the vertices
        for (let i = 0; i < start + 100; i++) {
            g.addVertex(i);
        }

        // Then add the number of edges, E, to the first 100 vertices
        let numberOfEdges = 0;
        for (let i = 0; i < 100; i++) {
            for (let j = 0; j < start; j++) {
                if (i !== j) {
                    g.addEdge(i, j);
                    numberOfEdges++;
                }
            }
        }
        plotData[0].x.push(numberOfEdges);

        // Then check for edges in the first 100 vertices
        const startTime = performance.now();
        for (let i = 0; i < 100; i++) {
            g.hasEdge(i, i + 1);
        }
        plotData[0].y.push(performance.now() - startTime);
    }

    plot(plotData);
}
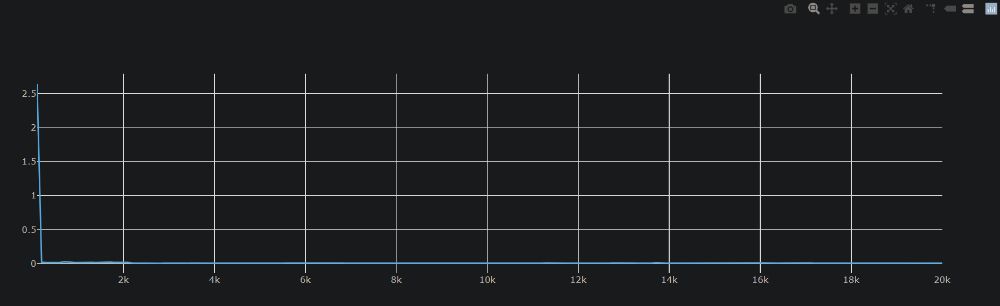
Yup, constant time.
I write about my software engineering thoughts and experiments. Want to follow me? I don't have a newsletter; instead, I built Tentacle: tntcl.app/blog.shalvah.me.
