A practical tracing journey with OpenTelemetry on Node.js
I've talked a good deal about observability, tracing and instrumentation in the past. Recently, I decided to try out some new things in those areas, and here's how it went.
The challenge
In my app Tentacle, there's an internal Node.js API which is called by the main app from time to time. This API in turn calls other external services, often more than once, and it can take anywhere from one to ten seconds for the whole thing to end, depending on the external services. I wanted to see how I could improve speed. Yes, the external service might be slow, but perhaps there was some way I could improve things on my end—better configuration, improved logic in handling the response, parallelization? I decided to add tracing so I could see if there were bottlenecks I could fix.
If you aren't familiar with tracing, think of it as being able to look inside your service to see what's going on. If I could instrument my app, I'd be able to view traces of my requests, which would show details about what my app did and how much time it spent. I've used Elastic APM and Sentry for tracing before, and there are other vendors as well, but I decided to try OpenTelemetry.
Why OpenTelemetry?
The idea behind OpenTelemetry is to be a "neutral" standard. It's like cables for charging your devices: each vendor can make something that works with their devices (eg Apple & Lightning cables), but USB was created so we could have a single standard, so in an emergency, you could borrow your friend's charging cable and know it works in your device.
OpenTelemetry (or "OTel" for short) is a set of vendor-agnostic agents and API for tracing. "Vendor-agnostic" doesn't mean you won't use any vendors, but that you aren't bound to them; if you have issues with Elastic (say, cost, features, or UX), you can switch to a different vendor by changing a few lines in your configuration, as long as the vendor supports the OpenTelemetry API. It's a beautiful idea, in theory. In practice, it has a few rough edges; for example, vendor-specific options often offer better UX than OTel.
Personally, I'd have preferred Sentry, since I use them for error-monitoring, but Sentry's tracing features are expensive. Elastic is free and open-source, but I didn't want to have to bother about running three components (Elasticsearch, Kibana and APM Server); even with Docker, Elasticsearch in production can still be a pain. I'd read and talked a lot about OpenTelemetry, so I figured it was time to actually use it.
Setting up locally
Tracing is most useful in production, where you can see actual usage patterns, but first I wanted to try locally and see if I could gain any insights. To set up OpenTelemetry, I'd need to install the agent and an exporter, then configure the agent to send to that exporter. An exporter is a backend (storage + UI) where I can explore the traces.
Setting up OTel took a while to get right (unfortunate but unsurprising). There was documentation, but it was confusing and outdated in some places. Eventually, I came up with this in a tracing.js file (which I'll explain in a bit):
const openTelemetry = require("@opentelemetry/sdk-node");
const { HttpInstrumentation } = require("@opentelemetry/instrumentation-http");
const { ExpressInstrumentation } = require("@opentelemetry/instrumentation-express");
const { ZipkinExporter } = require("@opentelemetry/exporter-zipkin");
const { Resource } = require('@opentelemetry/resources');
const { SemanticResourceAttributes } = require('@opentelemetry/semantic-conventions');

const sdk = new openTelemetry.NodeSDK({
    resource: new Resource({
        [SemanticResourceAttributes.SERVICE_NAME]: 'tentacle-engine',
        [SemanticResourceAttributes.DEPLOYMENT_ENVIRONMENT]: process.env.NODE_ENV,
    }),
    traceExporter: new ZipkinExporter(),
    instrumentations: [HttpInstrumentation, ExpressInstrumentation],
});

module.exports = sdk;
Holy shit, that is a ton of very-intimidating-looking code (and it gets worse later😭). In Elastic APM and Sentry, it would have been less than 4 lines. But on we go. The gist of the code is that it sets the service name to tentacle-engine, sets the exporter as Zipkin, and enables the automatic instrumentation of http and express modules. The service doesn't use any database or caching, so I didn't enable those.
Let's talk about the exporter. Because OTel is an open standard, you can theoretically export to any tool that supports the OTel API. For example, there's a ConsoleExporter included that prints traces to the console, but that's not very useful. There's an exporter to Elasticsearch, and you can write your own library to export to a file or database or whatever. However, two of the most popular options are Jaeger and Zipkin, and you can easily run them locally with Docker.
I tried both options, but decided to go with Zipkin because it's easier to deploy. Plus it has a slightly better UI, I think. Running Zipkin with Docker was easy:
docker run --rm -d -p 9411:9411 --name zipkin openzipkin/zipkin
And then I modified my app.js to:
- wait until tracing had been initialized before setting up the Express app
- wait until all traces were sent before exiting (when you hit Ctrl-C)
So it went from this:
const express = require('express');
const app = express();

app.post('/fetch', ...);
// ...

const gracefulShutdown = () => {
    console.log("Closing server and ending process...");

    server.close(() => {
        process.exit();
    });
};

process.on("SIGINT", gracefulShutdown);
process.on("SIGTERM", gracefulShutdown);
to this:
const tracing = require('./tracing');
tracing.start()
    .then(() => {
        const express = require('express');
        const app = express();

        // ...

        const gracefulShutdown = () => {
            console.log("Closing server and ending process...");

            server.close(async () => {
                await tracing.shutdown();

                process.exit();
            });
        };

        // ...
    });
It was quite annoying to move that code into a .then, but it was necessary: the express module has to be fully instrumented before you use it, otherwise the tracing won't work properly.
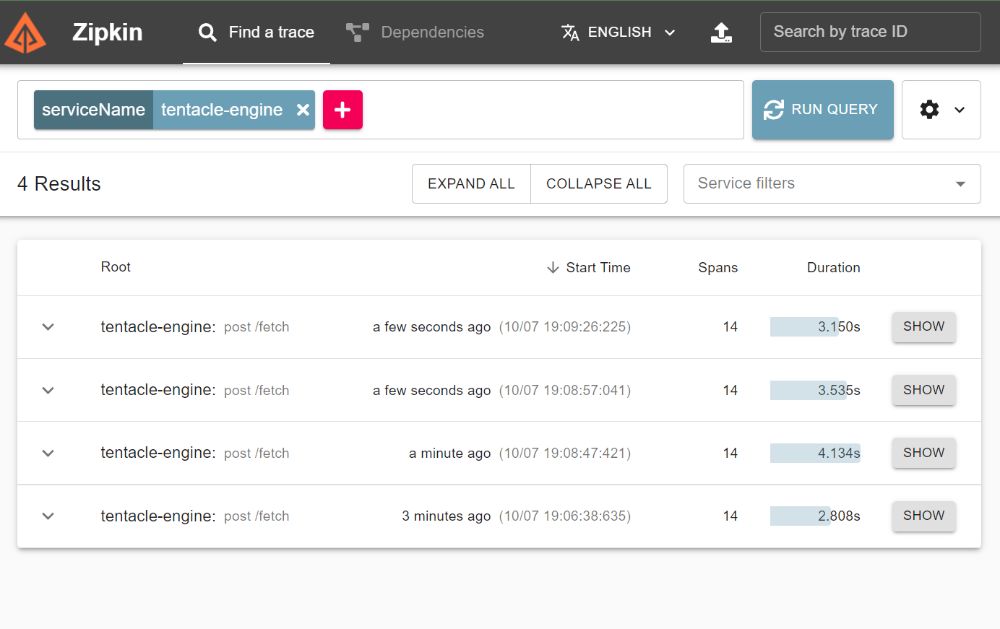
Finally, I was ready. Started my app and made some requests, opened Zipkin on localhost:9411, and the traces were there.
Inspecting and inferring
Now let's take a look at what a trace looks like. Here's the details view for a trace:
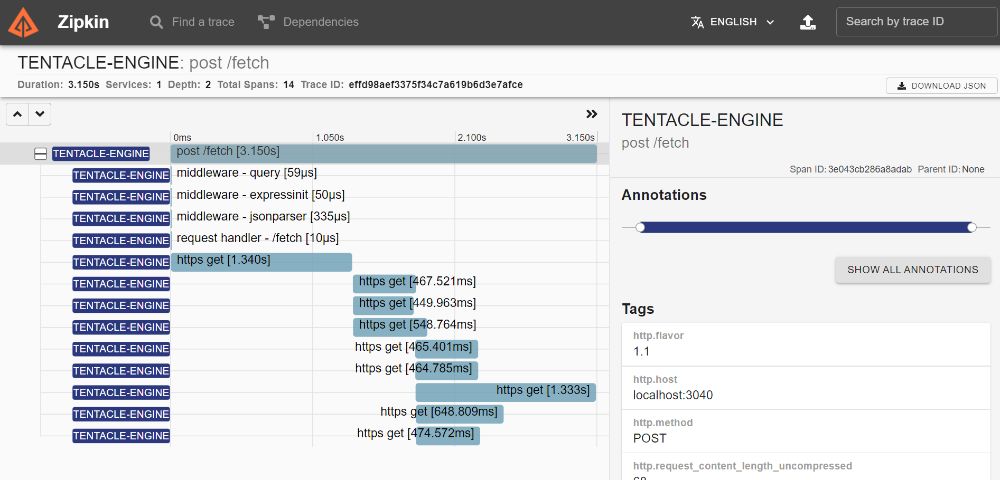
On the right, we have tags that contain relevant information about the trace. For example, an HTTP request would include details about the path, user agent, request size. On the left, we have the trace breakdown, showing the different spans that happened during the request. Think of a span as an action, like an incoming/outgoing request, a database or cache query, or whatever represents a "unit of work" in your app. In this request, we have 14 spans (1 parent and 13 children). We have spans recorded for each of our Express middleware, and then spans for the calls we made to the external services (https.get), 9 of them. (All these spans were captured automatically because we configured OTel to use the HttpInstrumentation and ExpressInstrumentation earlier.) Now, what can we glean from these?
First off, the bottleneck isn't in the framework or our code. You can see that the Express middleware take only microseconds to execute. Meanwhile the external requests take up almost all the time. You can see the first request alone takes 1.34s.
Let's hypothesize. Okay, the external site is obviously slow (and my local Internet is slow too), but how can we optimize around this? I decided to try switching my request client from got to the new, fast Node.js client, undici. Maybe I could shave some tens of milliseconds off?
I made a couple of requests, and here are the results. Using got first, and undici after. The duration each request takes is shown on the right.
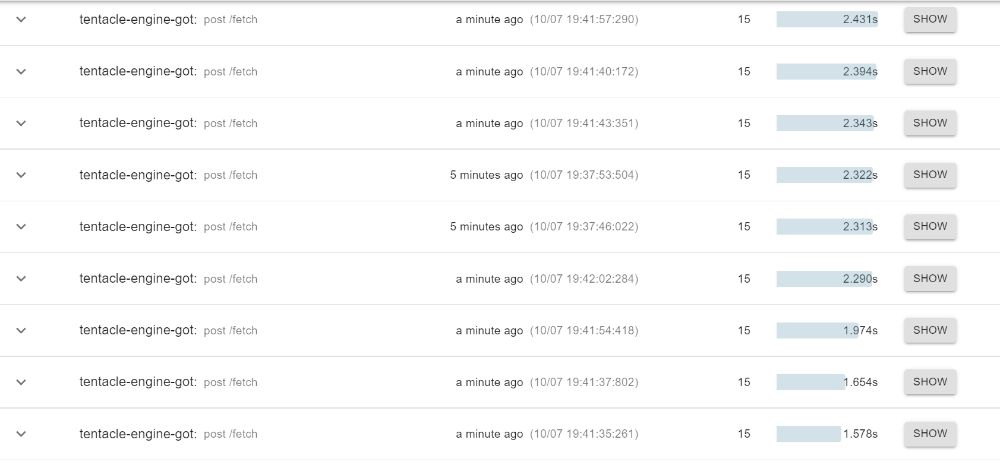
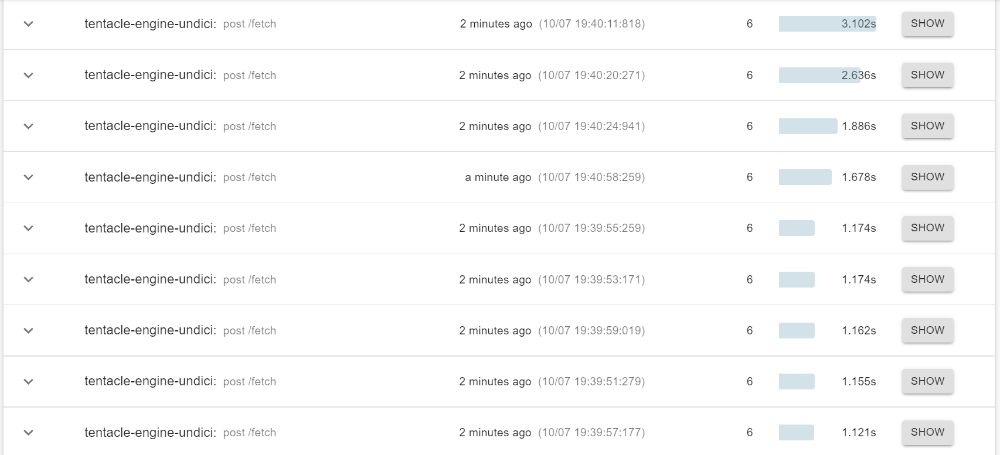
Well, what do you think?
The first thing I'm going to say is that this is not just an unscientific benchmark, but a bad one. It's silly to draw conclusions based on 10 requests made on my machine. So many factors could affect the performance of both libraries—fluctuating connection speeds (Nigerian internet does this a lot), machine features, machine load, etc. A more "scientific" benchmark would be to write a script that triggers hundreds of requests in mostly stable conditions and returns useful statistics like the average, max and standard deviation.
But there's an even better option: run both libraries in production for real-world requests, and see if there's a meaningful gain from undici. I learnt this approach from GitHub's Scientist. Sadly, this article is about tracing, not experimentation, so I won't continue down that path now, but I hope to write another article about it soon. My implementation would probably be to have a switch that randomly picks one of the two libraries for each request. Then I'll compare the metrics and see which performs better over time. undici also has some differences from got, so I'll need to double-check that it works correctly for my use.
That said, from these preliminary tests, it looks like most of undici's requests are faster than most of got's, but I'll hold off on switching until I can experiment in production.
Another thing I wanted to see was if I could reduce the number of external service calls, or parallelize them, maybe. You'll notice from the original trace I posted that there are 9 HTTP requests, done in three sets (1, then 3 in parallel, then 5 in parallel). I went through my code again, and realized two things:
- I couldn't parallelize any better; it had to be 1-3-5, because of dependencies on the response.
- In this particular case, I could actually get rid of the first external call!
Yup, it turned out that I could remove the first request. It would lead to more requests overall, but only two parallel sets. So I decided to try, and...
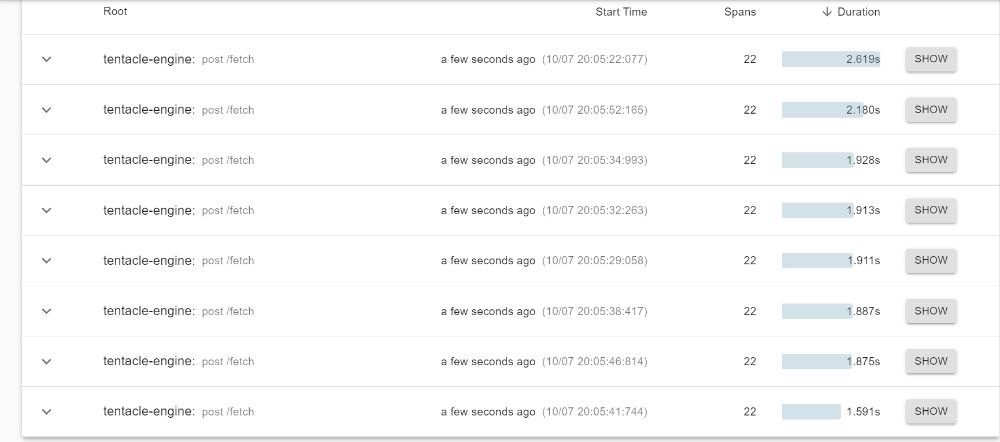
Compare these with the very first screenshot I posted—the previous times were around 3 seconds or more, while these are around 2 seconds. Big win!
Here's what a single trace looks like now:
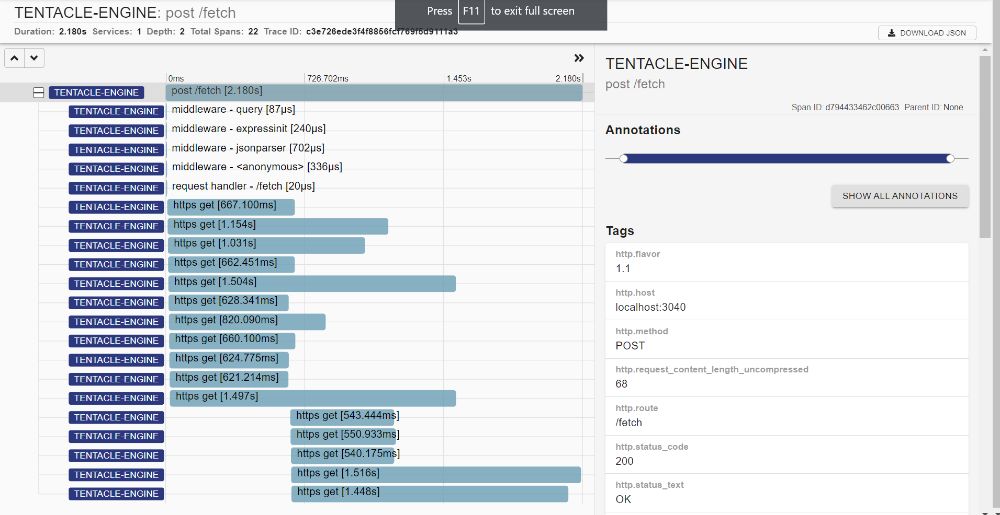
Like I said, more requests, but in less sets, leading to an overall time savings. However, once again, I decided to hold off on making the change permanent; I'll spend some more time and tests to be sure the endpoint logic still works consistently for all inputs with the first call removed.
I can't make the changes immediately, but it's obvious that tracing has been helpful here. We've moved from guessing about what works and what doesn't to seeing actual numbers and behaviour. It's awesome.
Manual instrumentation
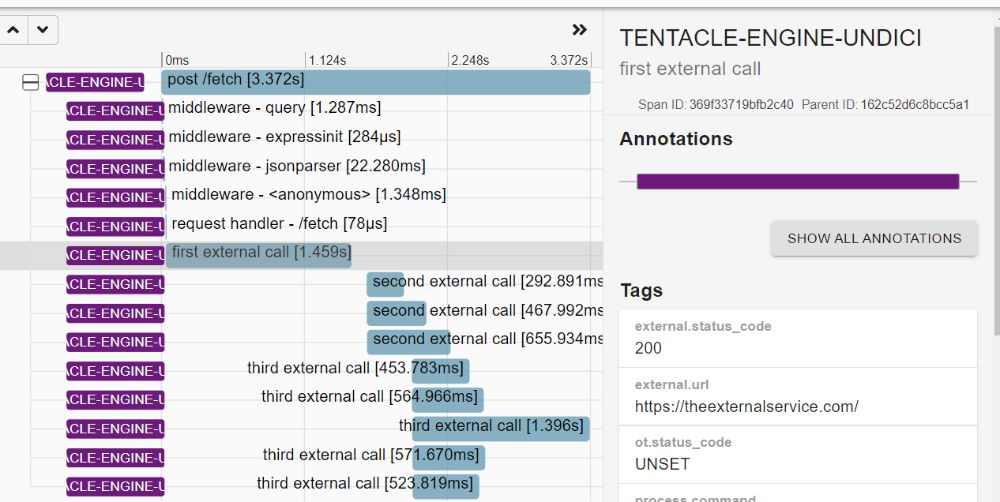
One problem with using undici is that it uses the net module, not the http module, making it difficult to instrument. If we use undici as our request client, we won't see any spans for http.get in Zipkin. If I enable OTel's NetInstrumentation, there'll be spans, but they will be for TCP socket connection events, not for a complete request-response cycle:
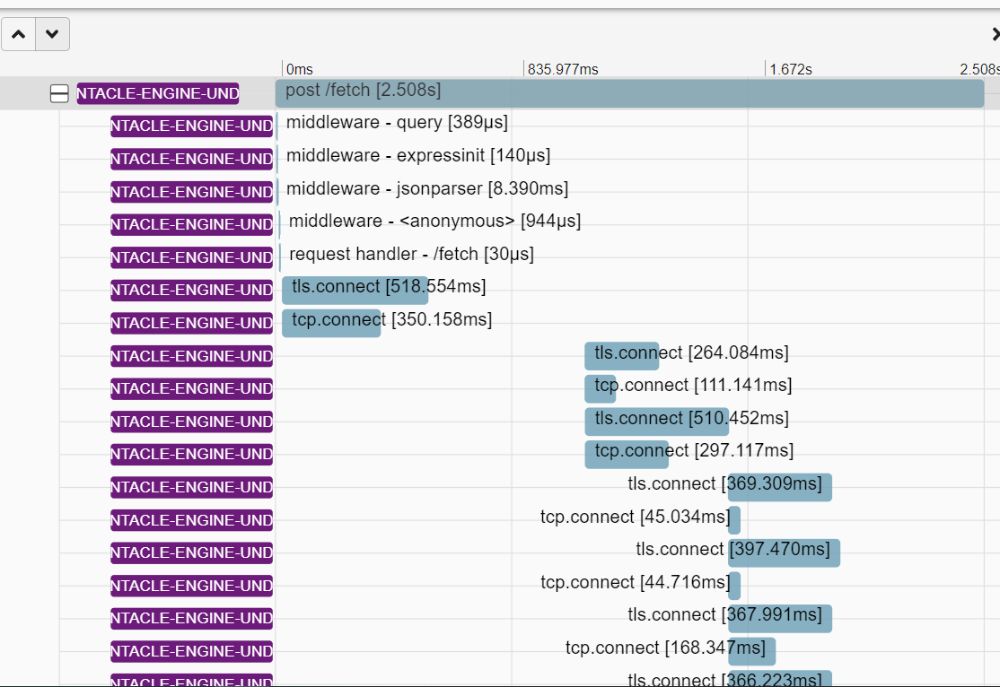
So I did some manual instrumentation to mark the request start and end, by wrapping each external call in its own custom span:
const { request } = require('undici');

function wrapExternalCallInSpan(name, url, callback) {
    const tracer = openTelemetry.api.trace.getTracer('tentacle-engine');
    let span = tracer.startSpan(name, {}, openTelemetry.api.context.active());
    span.setAttribute('external.url', url);
    const context = openTelemetry.api.trace.setSpan(openTelemetry.api.context.active(), span);
    return openTelemetry.api.context.with(context, callback, undefined, span);
}

// Promise version
const makeRequest = (url) => {
    return wrapExternalCallInSpan('first external call', url, (span) => {
        return request(url)
            .then((response) => {
                span.setAttribute('external.status_code', response.statusCode);
                return response.body.text();
            })
            .catch(handleError)
            .finally(() => {
                span.end();
            });
    });
};

// async/await version
const makeRequest = (url) => {
    return wrapExternalCallInSpan('second external call', url, async (span) => {
        try {
            let response = await request(url);
            span.setAttribute('external.status_code', response.statusCode);
            return response.body.text();
        } catch (e) {
            return handleError(e);
        } finally {
            span.end();
        }
    });
};
And we've got this!
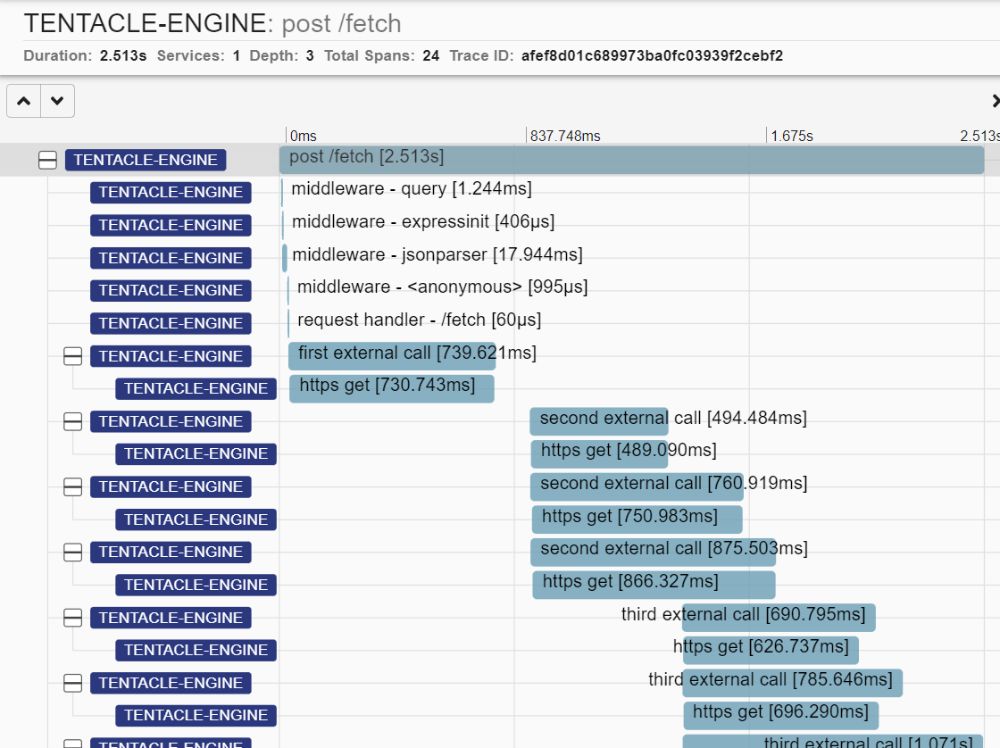
Now, even without auto-instrumentation for undici, we can still get a good overview of our requests. Even better, if we switch back to got, we see the https.get spans nested under our custom spans, which gives an insight into how much time was actually spent in the request versus in handling the response.
(PS: I'm naming the spans things like "first external call" here, but in my real codebase, they're named after what the request does, e.g. "check API status", "fetch user list".)
Capturing errors
I mentioned earlier that I'd have preferred to use Sentry. The reason for that (besides UX) is correlation. When an uncaught exception happens in my app, I'm able to view it in Sentry. However, I might want to view more details about what happened in that request. Sentry allows you to do this by attaching "context".
But sometimes, I might need more. I might want to investigate a report deeper, for instance, to see where the error was caused (my main app or the internal service), or when the error occurred (was it before or after the first set of external calls?), or how long the calls took and what they returned. So it's often ideal to have both error-monitoring and tracing in the same place. But I can't, so the next best thing is to make it easy to correlate.
To do that, I'll do two things:
- Add the trace ID to the Sentry context, so I can copy it from Sentry and look it up in Zipkin, and vice versa.
- Add some basic error details to the OTel trace, so I can see the error info right there.
const tracing = require('./tracing');
tracing.start()
    .then(() => {
        const express = require('express');
        const app = express();

        // Custom Express middleware: add the current trace ID to the Sentry context
        app.use((req, res, next) => {
            const { traceId } = getCurrentSpan();
            Sentry.setContext("opentelemetry", { traceId });
            next();
        });

        app.post('/fetch', ...);

        // 500 error handler: store the error details as part of the trace
        app.use(function onError(err, req, res, next) {
            const currentSpan = getCurrentSpan();
            const { SemanticAttributes } = require('@opentelemetry/semantic-conventions');
            currentSpan.setAttributes({
                [SemanticAttributes.EXCEPTION_MESSAGE]: err.message,
                [SemanticAttributes.EXCEPTION_TYPE]: err.constructor.name,
                [SemanticAttributes.EXCEPTION_STACKTRACE]: err.stack,
            });
            currentSpan.setStatus({
                code: require("@opentelemetry/sdk-node").api.SpanStatusCode.ERROR,
                message: 'An error occurred.'
            });

            res.status(500).send(`Something broke!`);
            gracefulShutdown();
        });

        // ...
    });

function getCurrentSpan() {
    const openTelemetry = require("@opentelemetry/sdk-node");
    return openTelemetry.api.trace.getSpan(openTelemetry.api.context.active());
}
Let's test this out. I'll enable Sentry on my local machine and add a line that crashes, console.log(thisVariableDoesntExist), somewhere in my request handler. Here we go!
Here's the exception context in Sentry:
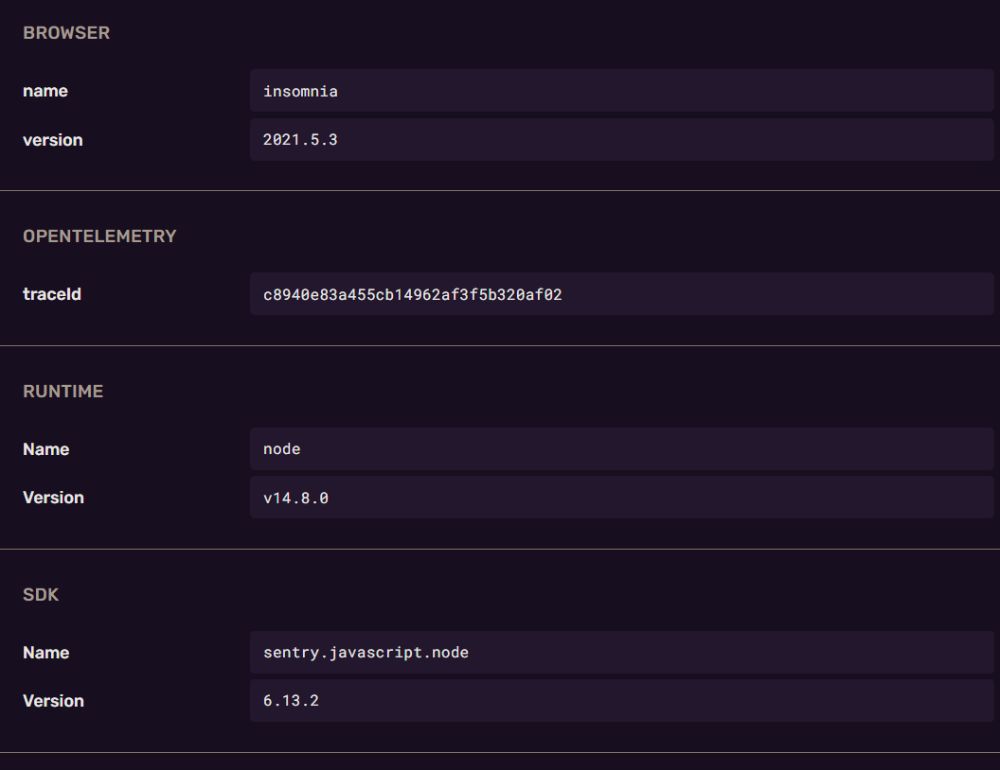
And we can take that trace ID and search for it in Zipkin (top-right):
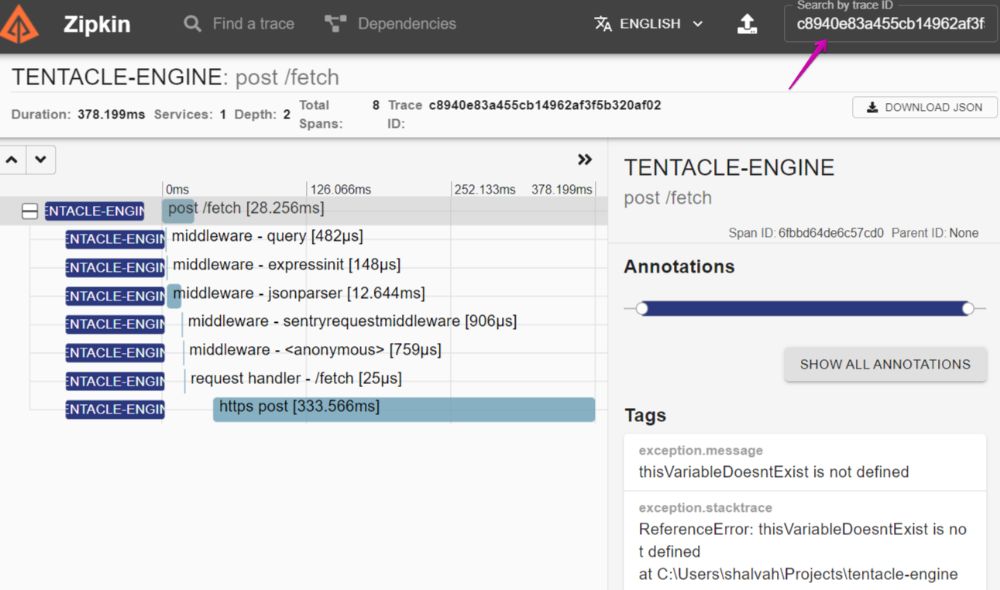
You can see the extra exception. attributes we added to the span in the right panel. And if we scroll further down, you'll see that the rest of the usual span attributes are there as well, allowing us to glean more information about what was going on in that request. On the left you can see a breakdown of all the action that happened, so we know at what stage the error happened. (There's an extra https.post, from the request to Sentry's API, and it happens after the 500 response has been sent.) We've successfully tied our Sentry exceptions with our OpenTelemetry traces.
(Thinking about) Going live
We could stop here, since we've gained some useful insights, but tracing is best in production, because then you're not just looking at how you're using the app, but at how real-world users are using it.
In production, there are more things to consider. Is your app running on a single server or across multiple servers? Where is your backend (Zipkin) running? Where is it storing its data, and what's the capacity? For me, the two biggest concerns were storage and security. My app runs on a single server, so obviously Zipkin was going to be there as well.
- Storage: I would have to write a script to monitor and prune the storage at intervals. I could, but meh.
- Security: I would need to expose Zipkin on my server to my local machine over the public Internet. The easiest, secure way would be whitelisting my IP to access port 9411 each time I want to check my traces. Stressful.
Honestly, I don't like self-hosting things, but I was willing to try. Luckily, I found out that some cloud vendors allow you to send your OTel traces to them directly. New Relic gives you 100 GB/8 days of retention on the free plan, while Grafana Cloud gives you 50 GB/14 days. I decided to go with New Relic, because their traces product is more mature and has more features I need, like viewing traces as graphs and filtering by span tags.
This complicates things a bit. There's no direct exporter library to New Relic, so we'll have to use yet another library: the OpenTelemetry Collector. There's a good reason we won't export directly to New Relic: it will have an impact on our application if we're making HTTP requests to New Relic's API after every request. The OTel collector runs as a separate agent on your machine; the instrumentation libraries will send traces to the collector, which will asynchronously export them to New Relic or wherever.
Here's what our tracing.js looks like now:
//...All those other require()s
const { CollectorTraceExporter } = require('@opentelemetry/exporter-collector');

const sdk = new openTelemetry.NodeSDK({
    // ...Other config items
    traceExporter: new CollectorTraceExporter({
        url: 'http://localhost:4318/v1/trace' // This is the Collector's default ingestion endpoint
    }),
});
To test this locally, we'll run the OTel Collector via Docker. First, we'll create a config file that tells it to receive from our OTel libraries via the OpenTelemetry Protocol (OTLP) and export to our local Zipkin (for now):
receivers:
  otlp:
    protocols:
      http:

exporters:
  zipkin:
    # This tells the collector to use our local Zipkin, running on localhost:9411
    endpoint: "http://host.docker.internal:9411/api/v2/spans"

service:
  pipelines:
    traces:
      receivers: [otlp]
      processors: []
      exporters: [zipkin]
Then we start the OTel Collector container:
docker run --name otelcol -p 4318:4318 -v ./otel-config.yaml:/etc/otel/config.yaml otel/opentelemetry-collector-contrib:0.36.0
(Note: I'm using the opentelemetry-collector-contrib distribution rather than the core opentelemetry-collector because the contrib version has additional processors we'll need later.)
This works. Our traces still show up in Zipkin, but now they're sent by the collector, not directly from our libraries.
Switching to New Relic was pretty easy. I changed the collector config to export to New Relic's ingest endpoint, with my API key:
# Other config...

exporters:
  otlp:
    endpoint: https://otlp.eu01.nr-data.net:4317
    headers:
      api-key: myApiKey

service:
  pipelines:
    traces:
      receivers: [otlp]
      processors: []
      exporters: [otlp]
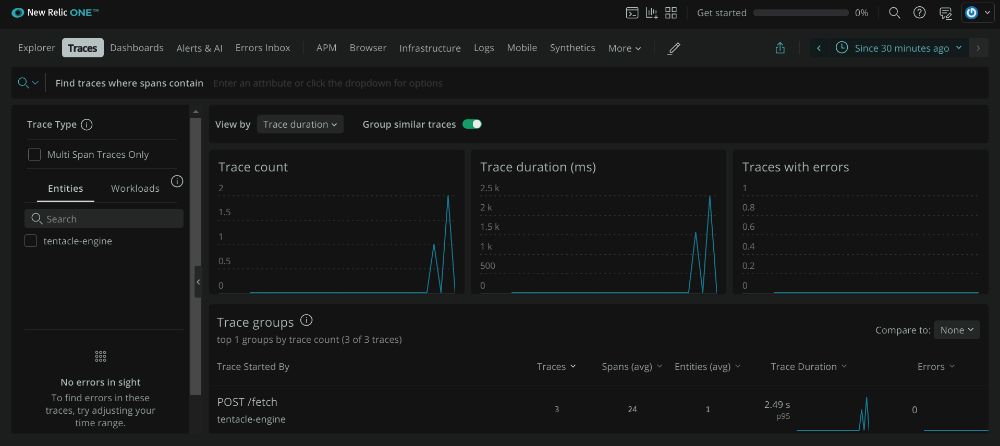
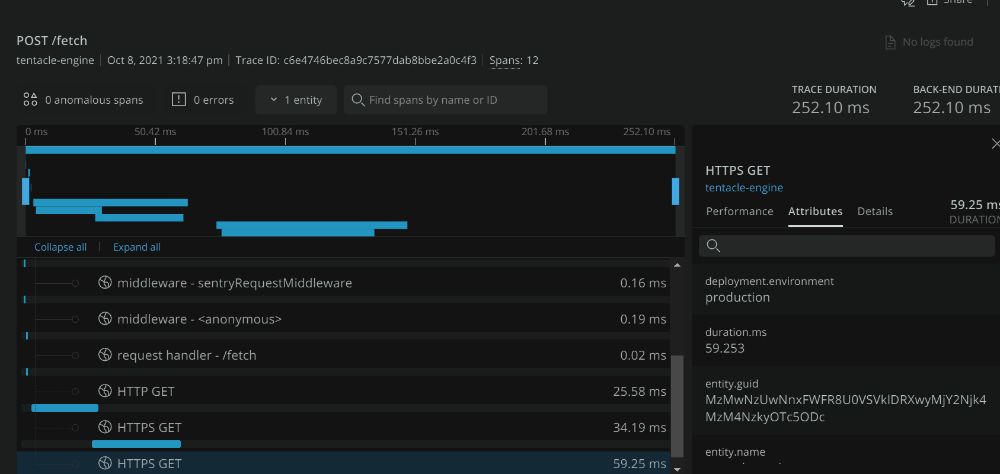
And when we restart the collector and make some requests to our API, we can see the traces in New Relic:
Sampling
We're almost ready to go live. But we have to enable sampling. Sampling means telling OpenTelemetry to only keep a sample of our traces. So, if we get 1000 requests in an hour, when we check Zipkin, we might see only 20. Sampling helps you manage your storage usage (and potentially reduces the performance impact from tracing on every request). If we recorded every sample from every request in production on a busy service, we'd soon have MBs - GBs of data.
There are different kinds of sampling. Here's what I'm going with:
//...All those other require()s
const { ParentBasedSampler, TraceIdRatioBasedSampler, AlwaysOnSampler } = require("@opentelemetry/core");

const sdk = new openTelemetry.NodeSDK({
    // ...Other config items
    sampler: process.env.NODE_ENV === 'development'
        ? new AlwaysOnSampler()
        : new ParentBasedSampler({
            root: new TraceIdRatioBasedSampler(0.4)
        }),
});
I'm using a combination of samplers here.
- In development mode, we want to see all our traces, so we use the
AlwaysOnSampler - In production, the
TraceIdRatioBasedSamplertracer will keep 40% of our traces. That means, if 10 requests come in, it will only trace 4 out of those. - But remember that our service will be called by another app, which may have its own trace that may or may not be kept. The
ParentBasedSamplersays, "if there's an incoming trace from another service that is being kept, then keep this trace too". That way, every trace from the main app that makes a request to tentacle-engine will have that child trace present as well.
Switching to tail sampling
The problem with our current sampling approach is that the keep/drop decision is made at the start of the trace (head sampling). The benefit of this is that it saves us from collecting unneeded data during the request, since we already know the trace will be dropped. But what about traces where an exception happens? I want to always have those traces, so I can look deeper at what happened around the error. Since there's no way to know whether an error will happen at the start of a trace, we have to switch to tail sampling.
Tail sampling is making the keep/drop decision at the end of the trace. So we can say, "if this request had an exception, then definitely keep the trace. Otherwise, do the ratio thing." Here's how I did this:
- FIrst, disable sampling in the OTel JS agent (use the
AlwaysOnSampleror remove thesamplerkey we added above). - Next, update the OTel collector config to handle the sampling:
Essentially, we've moved our# Other config... processors: groupbytrace: wait_duration: 4s num_traces: 1000 probabilistic_sampler: sampling_percentage: 40 service: pipelines: traces: receivers: [otlp] processors: [groupbytrace, probabilistic_sampler] exporters: [otlp]0.4ratio config into the collector'sprobabilistic_samplerconfig (0.4 = 40%). Thegroupbytraceprocessor makes sure all child spans of a trace are included. Without it, the sampler might choose to keep a child span (likefirst external call), while dropping the parent (POST /fetch), which wouldn't make sense. - FInally, in our 500 error handler, we add this:
app.use(function onError(err, req, res, next) { // ... currentSpan.setAttributes({ 'sampling.priority': 1, // ... }); // ... });sampling.priorityis a convention supported by the probabilistic_sampler. Setting it to 1 tells the sampler to override the ratio and keep this trace.
Batching
One final thing we need to do before deploying is batch our exports. By default, immediately a request ends, its trace is sent to Zipkin. In production, that might be unnecessary overhead, so we'll send them in batches.
//...All those other require()s
const { BatchSpanProcessor } = require("@opentelemetry/sdk-trace-base");

const exporter = process.env.NODE_ENV === 'development'
    ? new ZipkinExporter()
    : new CollectorTraceExporter({ url: 'http://localhost:4318/v1/trace' });
const sdk = new openTelemetry.NodeSDK({
    // ...Other config items
    spanProcessor: new BatchSpanProcessor(exporter),
});
The BatchSpanProcessor will wait for a bit to collect as many spans as it can (up to a limit) before sending to the backend.
Going live (finally)
To go live, we need to set up the OpenTelemetry collector on the server:
 wget https://github.com/open-telemetry/opentelemetry-collector-contrib/releases/download/v0.36.0/otel-contrib-collector_0.36.0_amd64.deb
 sudo dpkg -i otel-contrib-collector_0.36.0_amd64.deb
Running this installs and starts the otel-contrib-collector service. Then I copy my config to /etc/otel-contrib-collector/config.yaml and restart the service, and we're good. Now we deploy our changes, and we can see traces from production on New Relic.
Reflection
I still have to write another article about experimenting with both got and undici in production, but I've got thoughts on OpenTelemetry. First, the things I don't like:
- Asynchronous initialization.
tracing.start().then()is a pain. Other APM vendors know this and made their setup synchronous. - There's less abstraction and more verbosity. Look at the things we've had to deal with in the
tracing.js—processors, exporters, resources, semantic conventions. - Related to the above: There are too many packages to install to get a few things working. Worse, there's a compatibility matrix that expects you to compare four different versions of your tools.
- Additionally, the package structure is unclear. It's not always certain why a certain export belongs to a certain package. And a lot of exports have been moved from one package to another, so old code examples are incorrect.
- Confusing documentation: A lot of the docs still reference old links and deprecated packages. Some things are just not covered and I had to read issues, type definitions, and source code to figure things out. Another thing that confused me was that there are two different ways to go about tracing with OTel JS (the simpler way we used here vs a more manual way), but this isn't mentioned anywhere.
I feel bad complaining, because the OpenTelemetry ecosystem is HUGE (API, protocols, docs, collector, libraries for different languages, community...). it takes a massive amount of effort to build and maintain this for free, and you can tell the maintainers are doing a lot. Which is why, despite all the rough edges, I still like it. It's a good idea, and it's pretty cool how I can wire different things together to explore my data. Once you get over the rough patches, it's a pretty powerful set of tools.
If you're interested in digging deeper into OpenTelemetry, the awesome-opentelemetry repo has a collection of useful resources.
I write about my software engineering thoughts and experiments. Want to follow me? I don't have a newsletter; instead, I built Tentacle: tntcl.app/blog.shalvah.me.
